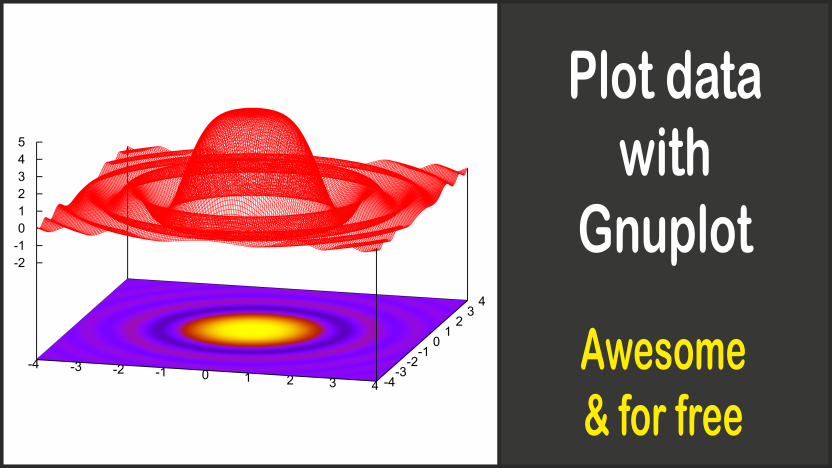
Gnuplot is a free and simply awesome program that lets you visualize data.
Table of contents
General information
Some of you perhaps had the problem that you have programmed something with calculations and you would like to visualize that, so that you can better estimate if the data behaves as it should behave.
Install and use Gnuplot
Example program in C
Let's take a look to this constructed example program written in C code:
#include <stdio.h>
#include <stdlib.h>
#include <math.h>
#include <time.h>

struct Data {

double x, y;

};

void Plot(struct Data center, struct Data *data, int number_of_data) {	// This function plots the circle

int i;

FILE *file;
file = fopen("C:/Test-Programm/center.txt","w");
fprintf(file, "%lf,%lf\n", center.x, center.y);	// Coordinates of the center are written into the file center.txt
fclose(file);
file = fopen("C:/Test-Programm/output.txt","w");
for(i = 0; i < number_of_data; i++) fprintf(file, "%lf,%lf\n", data[i].x, data[i].y);	// Coordinates of the data points are written into the file output.txt
fclose(file);

}

int main() {

struct Data circle[100], center;
int i, radius = 1, marker = 1;
time_t time1;

center.x = 0.0;	// X-coordinate of center
center.y = 0.0;	// Y-coordinate of center
while(1) {

	time1 = time(0);
	for(i = 0; i < 100; i++) {	// Calculates 100 data points for the circle

		circle[i].x = radius*cos(6.28*i/100);
		circle[i].y = radius*sin(6.28*i/100);

	}
	while(time(0) - time1 < 1);	// Wait 1 second
	if(radius < 10 && marker) radius++;	// Increase radius to a maximum of 10
	if(radius > 1 && !marker) radius--;	// Decrease radius to a minimum of 1
	if(radius == 10) marker = 0;	// Change direction
	if(radius == 1) marker = 1;	// Change direction
	Plot(center, circle, 100);	// Calls the function to plot the circle

}
return 0;

}
This program calculates 100 data points of a circle and writes every second the coordinates of the center in the file center.txt and the coordinates of the data points into the file output.txt. The radius of the circle changes every second. If we plot this, we could see a circle around the origin, which grows and shrinks repeatedly. And that's what we want to see now.
Install Gnuplot
To plot the created data of the C program, you must download Gnuplot. Afterwards, install the program normally.
Plot with Gnuplot
Plotting with Gnuplot could not be easier. We create another file, for example plot.txt in the same directory where the files of the plotting data are (so in the example from above: C:\Test-Programm\) and write into:
set xzeroaxis
set yzeroaxis
set xrange [-11:11]
set yrange [-11:11]
set datafile separator ","
plot "center.txt" using 1:2 notitle with points pointtype 7,\
"output.txt" using 1:2 notitle with points, \
"output.txt" using 1:2 notitle with lines
replot
pause 1
reread
Now we start Gnuplot and click on Open and chose the created file (you have to select All Files(*.*)). Now the plot window should open.
So Gnuplot reads and plots the data every second. When you now start the C program, you should see a circle, which grows and shrinks repeatedly:
Here you can download the files: Gnuplot example.
Create GIF animation
As you can see, you can also create GIF animations easily: You only have to change the file plot.txt:
set xzeroaxis
set yzeroaxis
set xrange [-11:11]
set yrange [-11:11]
set datafile separator ","
plot "center.txt" using 1:2 notitle with points pointtype 7,\
"output.txt" using 1:2 notitle with points, \
"output.txt" using 1:2 notitle with lines
replot
pause 1
i = i+1
if(i < n) reread
And also you have to create another file called creategif.txt:
reset
set term gif animate
set terminal gif animate delay 50
set output "animate.gif"
n = 18    #n frames
i = 0
load "plot.txt"
set output
Now we start the C program, then we open the file creategif.txt with Gnuplot and afterwards we only have to wait a few seconds for the GIF creation.
Here you can download the files: Gnuplot example: create GIF.